
What's new from Grafana Labs
Grafana Labs products, projects, and features can go through multiple release stages before becoming generally available. These stages in the release life cycle can present varying degrees of stability and support. For more information, refer to release life cycle for Grafana Labs.
Loading...
Area of interest:
Cloud availability:
Cloud editions:
Self-managed availability:
Self-managed editions:
No results found. Please adjust your filters or search criteria.
There was an error with your request.
Page:
Grafana Fleet Management now supports Amazon Web Service (AWS) PrivateLink. You can securely connect your virtual private clouds (VPCs) to Fleet Management APIs without using the public internet.
With AWS PrivateLink, you can:
- Reduce your AWS egress costs.
- Improve security by keeping your data within the Amazon network.
The days of manually deleting inactive collectors from your inventory are over! Grafana Fleet Management now automatically marks collectors inactive if they haven’t polled for a remote configuration in the last 3 hours. Collectors that are inactive for 30 days are deleted from your inventory.
By default, inactive collectors are hidden from view in the Fleet Management application. You can switch the filter to Inactive to see them.
We’ve redesigned the Reporting feature to make the report creation process simpler and more intuitive!
Key updates include:
- Creating reports from dashboards while maintaining dashboard context
- One-page report creation
- Easy access to organization report settings
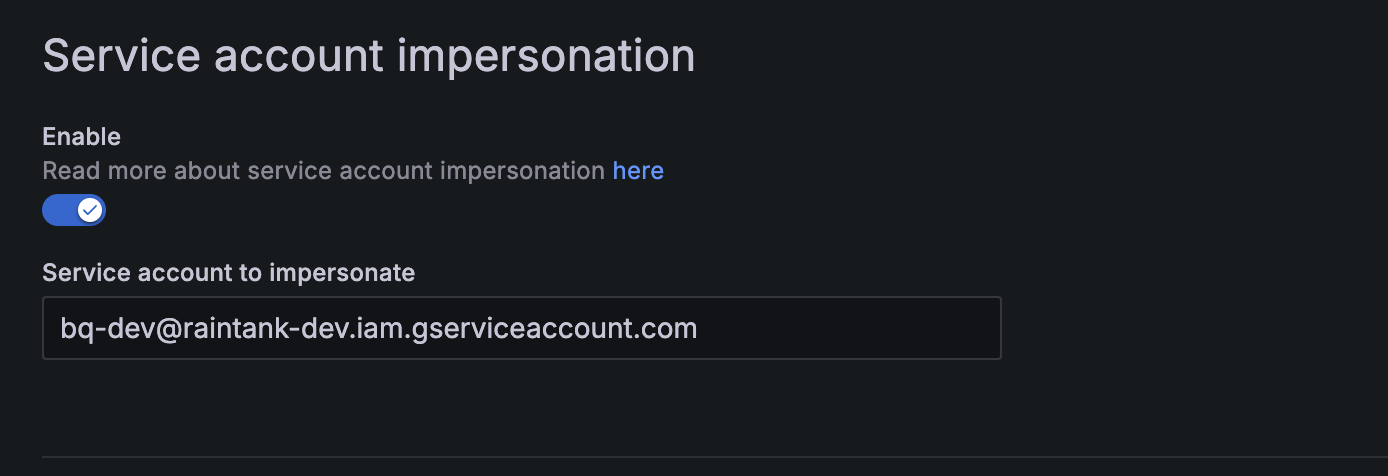
For better security, Google advises using Service Account Tokens with Service Account Impersonation. If a Service Account Token is ever compromised, it can’t be used to access Google Cloud APIs without the associated service account for impersonation, making it much harder for unauthorized access. This added security layer is now supported in the BigQuery data source configuration.
Introducing LogicMonitor data source plugin.
The LogicMonitor Devices data source plugin enables you to query and visualize Device Instance Data, and to list Devices, Datasources, and Instances directly within Grafana.
We’re excited to announce the public preview release of new alerting capabilities for Synthetic Monitoring. These new capabilities are available to all Grafana Cloud users.
You can now create alerts for each check in your Synthetic Monitoring application. For example, you can create an alert based on the number of check failures in a specific time window, with different settings for each one of your checks.
The pipeline history feature in Fleet Management now offers you the chance to restore versions of existing configuration pipelines. From the History details page, choose a version and click Restore.
Here’s how it works:
- Restoring a pipeline version overwrites the configuration of the current pipeline.
- A restored pipeline is set to the same Active or Inactive state as the pipeline it overwrites.
- When a pipeline version is restored, its matching attributes can also be restored, or the matching attributes from the overwritten pipeline can be persisted in the restored version.
Pipelines in Grafana Fleet Management can now leverage the Alloy export block
to share their components with other pipelines. With
pipeline export injection, you can export components from one configuration pipeline and inject them into another using the syntax argument.pipeline_exports.value["PIPELINE_NAME"]["EXPORT_NAME"]. This powerful feature enables you to create dynamic configurations that adapt to each pipeline’s exported values, allowing for flexible and reusable pipeline configurations.
Sort and filter logs with ease in the Logs and Events tables. You can use multiple filters, including:
- Time period
- Component
- Cloud region
- Error level

Find any non-standard workloads using filters on the Workloads main page. Filtering includes:
- Argo Rollouts
- Strimzi Pod sets
- Unmanaged (or static) Pods
- CronJobs
- Bare Pods

The memory tab and panels are accessible on any detail page beyond the container level. Now you can view memory usage in correlation with relevant data points, as shown in the screen capture of a namespace.
In this case, you can see at a glance key data such as:
With early detection patterns, Adaptive Logs now shows log patterns without waiting to see how often they are queried. This feature allows you to proactively detect and filter out wasteful logs, ensuring only the most valuable telemetry is ever shipped to Grafana Cloud.
We’ve updated the main navigation in Grafana Cloud to bring all observability tools together under a single menu called Observability. You’ll now find App Observability, Frontend Observability, Kubernetes Monitoring, Infrastructure Monitoring, Cloud Provider Observability, and more grouped in one place.
This change is part of our effort to provide:
- A simpler, more consistent experience across observability tools
- Faster access to relevant signals and workflows
- A foundation for deeper, context-aware troubleshooting powered by Grafana’s Knowledge Graph
We’re excited to introduce SLO Reports—a powerful new feature in Grafana SLO that enables users to report on multiple service level objectives (SLOs) on a weekly or monthly basis.
With SLO Reports, you can now:
- Consolidate multiple SLOs into a single, easy-to-digest report
- View individual and combined SLI (Service Level Indicator) metrics
- Understand weighted contributions of each SLO to the overall SLI performance
You can now sync Grafana IRM’s phone numbers to your mobile contacts. This helps you recognize IRM calls and allows you to bypass Do Not Disturb (DnD) for urgent alerts.
Benefits
- Incoming IRM calls and SMS messages appear with the contact name Grafana IRM instead of an unknown number.
- You can configure your phone to allow calls and messages from Grafana IRM to override DnD or silent mode.
How it works
- In the IRM mobile app, go to Settings > Sync Grafana IRM contact.
- Toggle the setting on to enable.
- The app will create a contact named Grafana IRM using known IRM phone numbers.
The list of phone numbers is updated automatically whenever you open the app and new numbers are available. Once enabled, this setting adds a contact card with our verified SMS and call numbers.
Kubernetes Monitoring offers CPU tabs with insightful panels on every detail page beyond the container page to provide you with quicker troubleshooting and better resource planning. You can gain deeper visibility from cluster to pod with utilization efficiency graphs and CPU distribution analysis.
CPU tabs available at every level beyond the container give you:
- An edge for finding issues
- Capacity sizing insights to optimize performance
