-
Notifications
You must be signed in to change notification settings - Fork 628
Description
Describe the bug
We're using the Metrics Generator
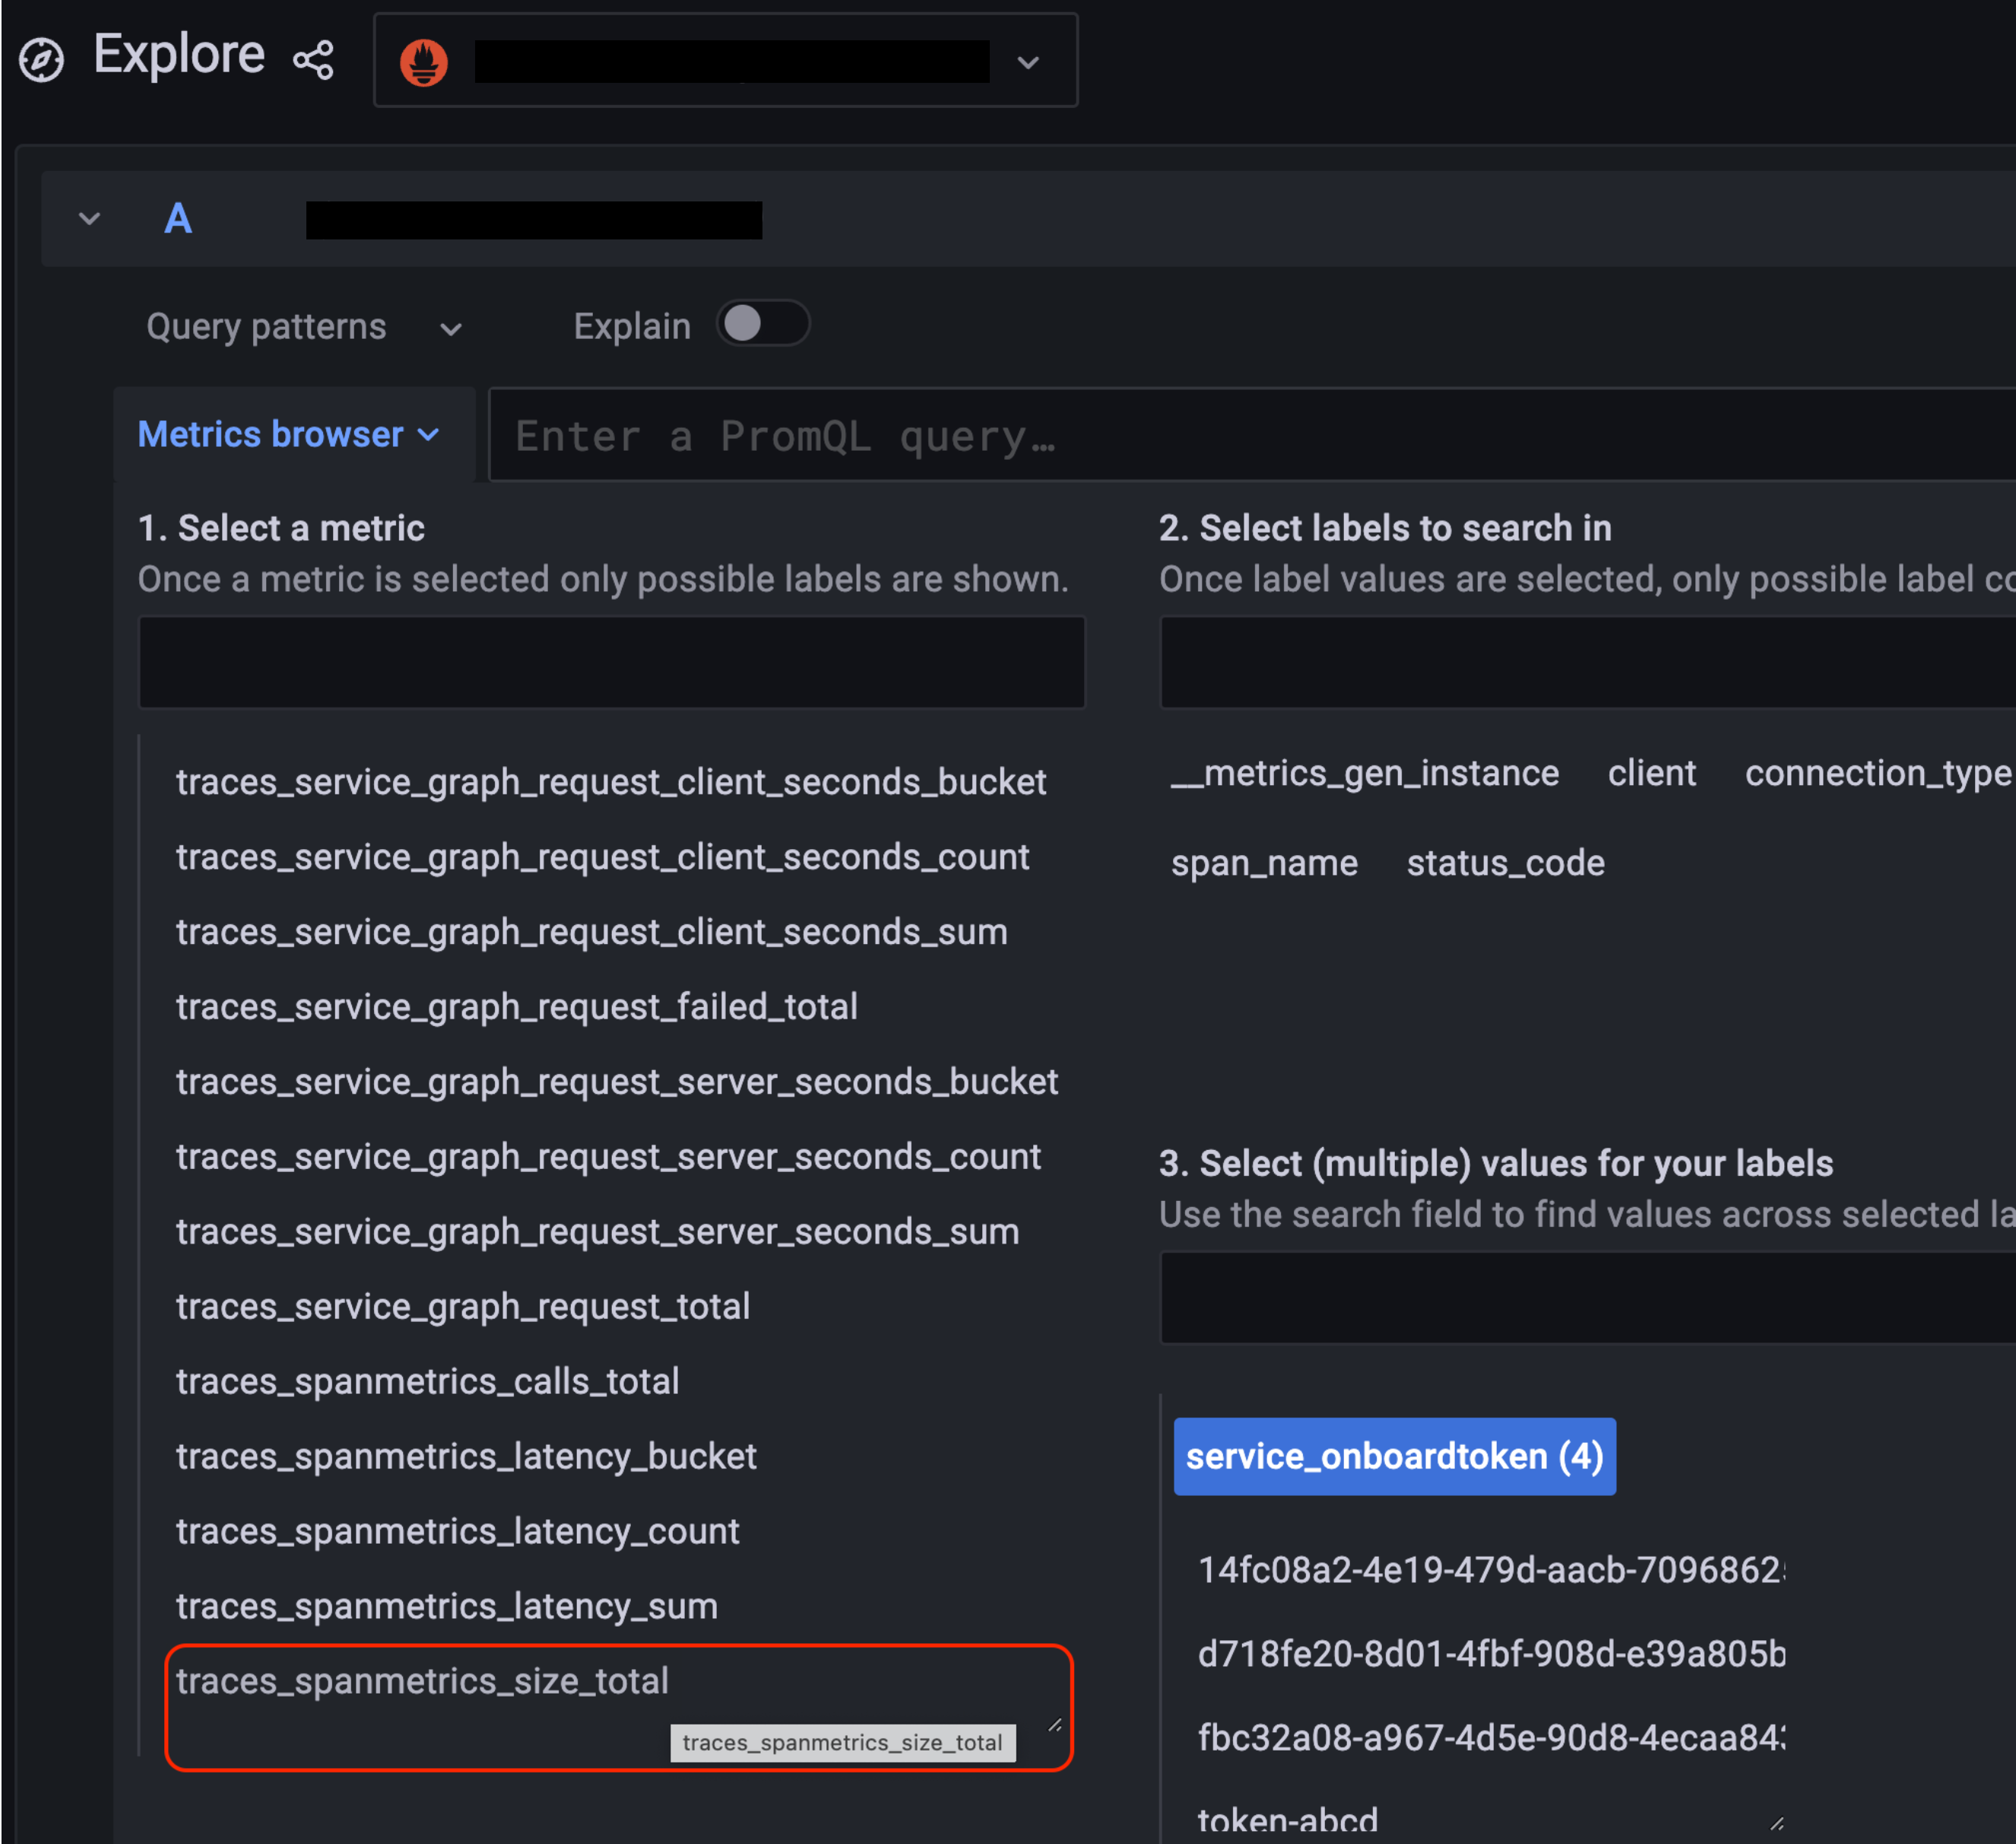
But the metrics generated have no HELP text or metadata associated with them in Grafana-Cloud Prometheus datasource:
From @danielkenlee
I was exploring some trace metrics in the metrics browser today on a customer instance and noticed the help documentation doesn't seem to be loading into the metrics data source for Tempo Metrics Generator metrics.
See example for traces_spanmetrics_size_total - here I might expect some details about dimensions (kb, Mbs etc.) Upon hovering over traces_spanmetrics_size_total the popup simply repeats the metric name. Is this behaviour intended? Should help text appear here?
To Reproduce
Use the metrics generator as per:
https://grafana.com/blog/2022/05/02/new-in-grafana-tempo-1.4-introducing-the-metrics-generator/
Then try to access the metadata for the derived metrics, and see that it is missing.
Expected behavior
In the Metrics Browser, when I hover the metric name for a Temp Derived metric, the HELP text should be available
Environment:
- Infrastructure: GrafanaCloud
Additional Context
None
