
Visualize complex and hidden patterns
Put connections at the center of your analytic workflows, and enable iterative data visualization and exploration.
Use cases include:
OSINT investigations
Legal E-discovery
Anti-Money Laundering
Fighting Collusion
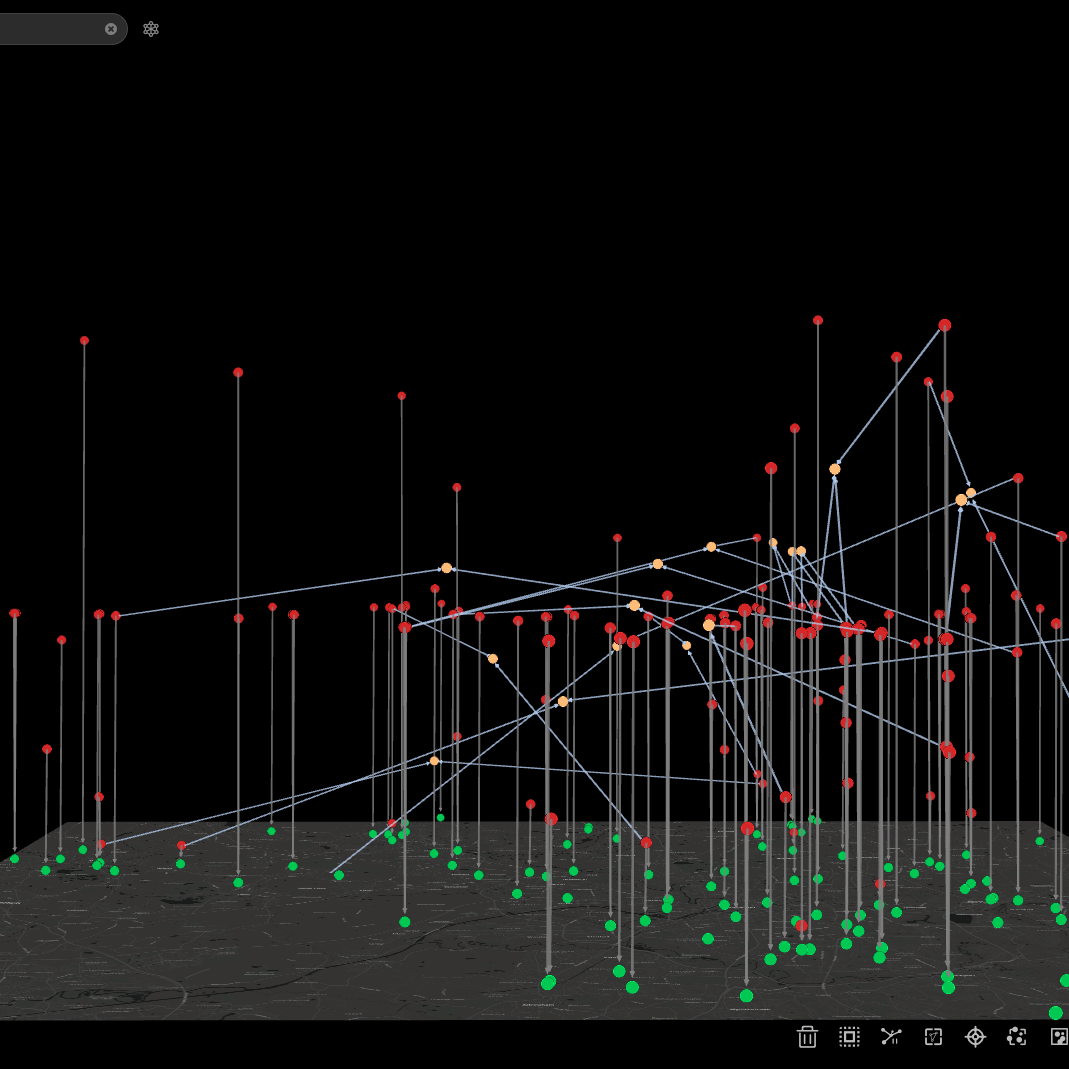
Exploring connected data in an immersive browser-based platform.
Gather and merge data for focused visualization
Fuse and transform data from a wide range of sources. Connect to and query graph and relational databases. AI-assistance makes it even easier to extract entities and relationships from CSVs and many other file formats.
Visualize, analyze and collaborate
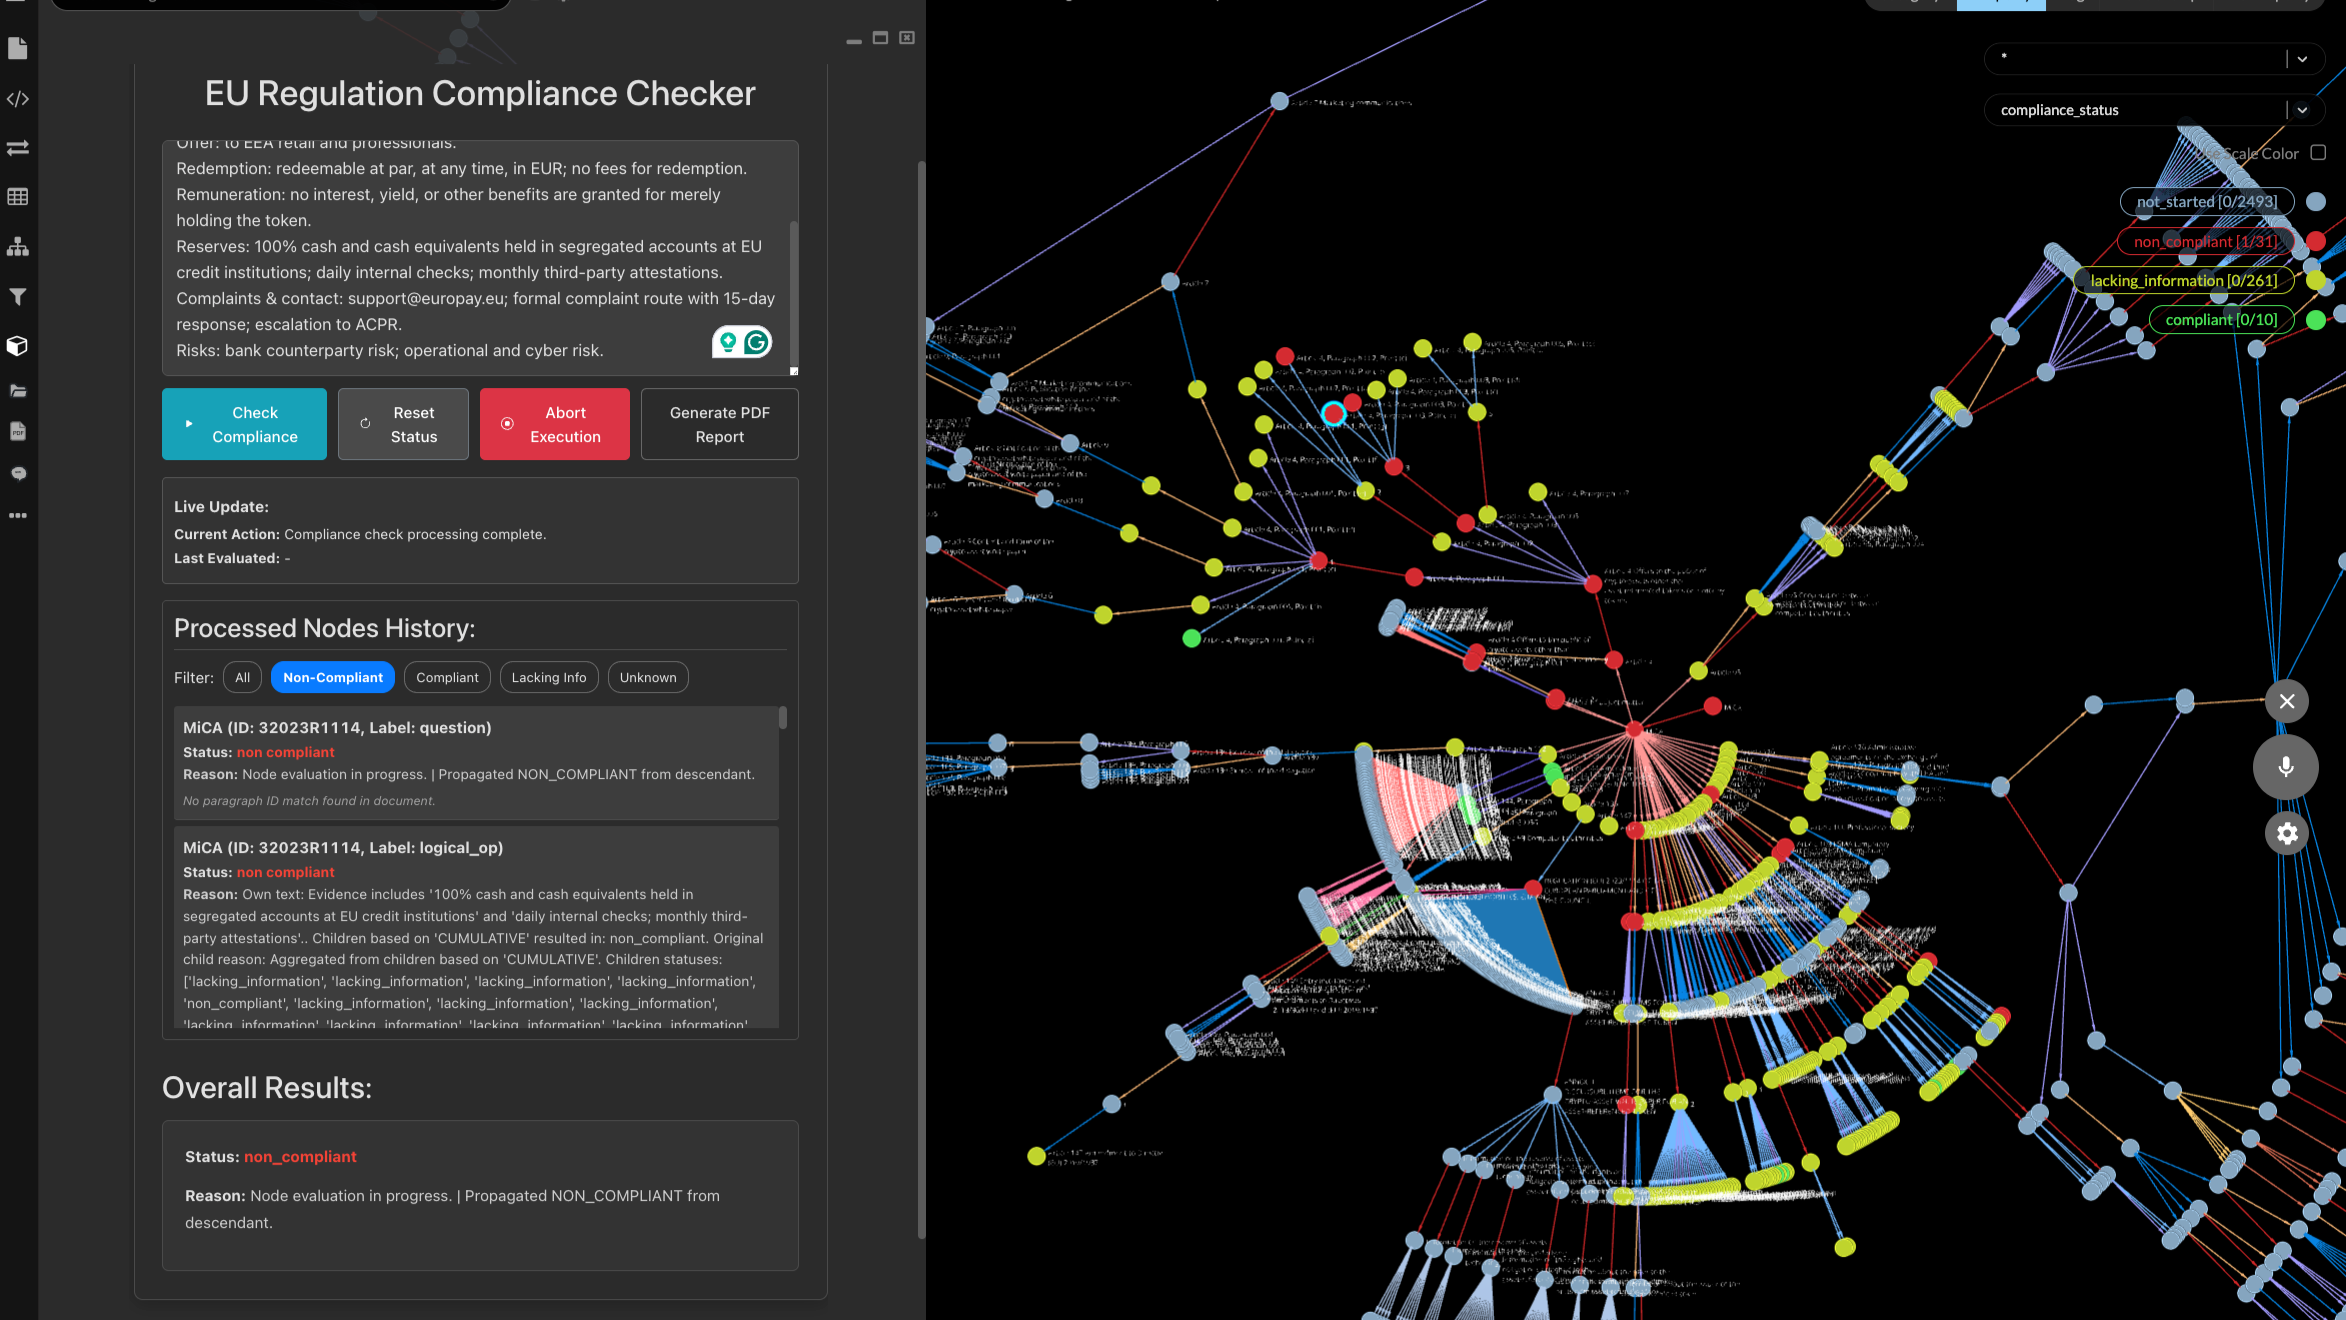
Visualization
Rapidly visualize and explore data from graph or relational databases, CSV or JSON files, and 3rd party APls. Fine-tune your graph on the fly with portrait images, icons, custom colors and layouts.

Analysis
Discover hidden connections with powerful graph analytics like path finding, centrality, and community detection. Iterate views of your connected data to support geospatial, time series, and social network analysis.
Secure Collaboration
Provide controlled access to shared projects and charts with team members and stakeholders. Enterprise deployments exist entirely inside your IT ecosystem, whether on-premises, private cloud, or even air-gapped.
Learn More
Master graph skills with our self-paced learning resources, or schedule live Kineviz training.